![]()
1. Geog0027 Coursework
Prepared by:
Dr Qingling Wu, Prof Philip Lewis, Dr Mathias Disney
Contact: Prof Lewis
1.1. Introduction
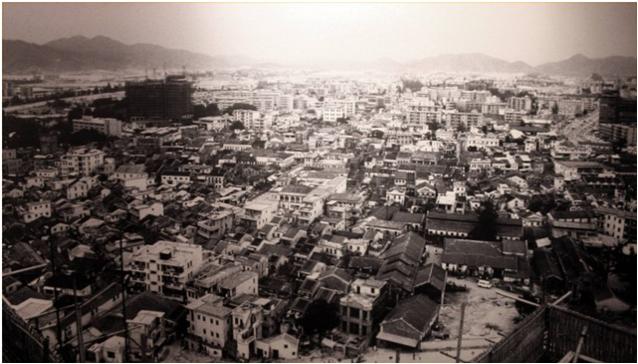
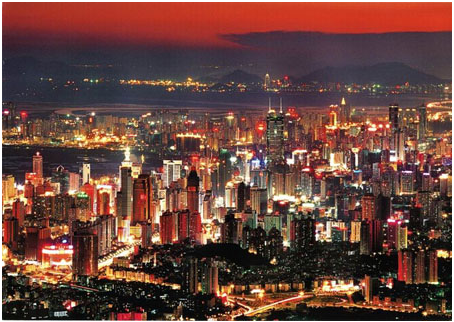
The Pearl River Delta, and particularly Shenzhen City, in Southern China has been going through a dramatic urbanization process since 1978 due to decentralization policies and market-oriented reforms.
[6]:
%matplotlib inline
from IPython.display import IFrame
IFrame('http://svs.gsfc.nasa.gov/stories/Landsat/pearl_river.html','100%',490)
[6]:
[7]:
IFrame('https://earthengine.google.org/timelapse/player?c=https%3A%2F%2Fearthengine.google.org%2Ftimelapse%2Fdata&v=22.5500,114.1000,8.5&r=.5&p=true"','100%',490)
[7]:
1.2. Purpose of the practical
In this project, we aim to quantify the change of land use due to urbanization, and attempt to explain such change by a number of important socioeconomical drivers. Yearly Landsat TM images are given from 1986 to present.
1.3. Overview of task
The project is most clearly phrased in two parts:
1. Classification of land cover from a series of Landsat images
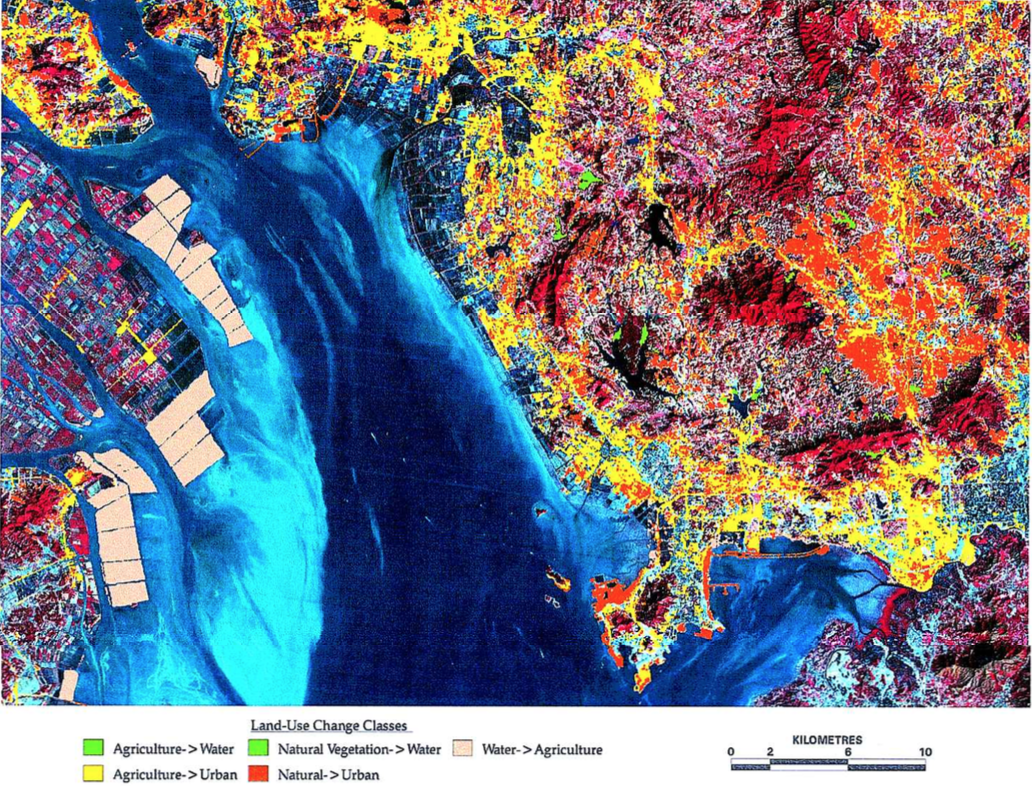
As a first step, we need to quantify at least three types of land use for each given year, namely, urban, cropland, and other. In many circumstances, we would want to have cartegories of other as well, but this is not strictly necessary for this practical. Then, we can identify where changes have happened and how much land area has been transformed into urban. See example the land use change map below from Seto et al. 2002 as anexample of this.
We want to be able to classify quite a large number of images, so we need to bear that in mind when considering what approach to take.
A number of classification methods have been taught in this module, and Maximum Likelihood is often a good starting point for multispectral TM imagery. There are also other image processing methods could help to identify land use classes (e.g. vegetation indices, filters, segmentation, etc.). However, if we need to apply training for each scene, the task soon becomes very tedious. We could try to use the same training data for each scene, but this might not work well across multiple sensors.
Instead, we shall use a method of unsupervised classification (ISOdata clustering) to process the bulk of the data. This shifts the problem from one of large manual effort in providing the training datasets to a smaller manual effort making sure we interpret the machine-generated clusters appropriately. This is a basic trade-off of unsupervised versus supervised methods.
In this work then, you will apply a supervised method and an unsupervised method to one scene, then assess the classification accuracy of your approaches. Because of the large number of images involved in the project, we will use an envi program (provided to you) to automate the process of unsupervised classification for the rest of the datasets.
After you have performed the classifications, you will process each dataset to estimate the area of urban land cover per year. Again, because of the large number of images involved, we will use an envi program to do this.
2. Modelling Land Use change with socio-economic drivers
Having derived a dataset of urban land use, we can calculate urban land use change per year.
Following the general approach of Seto & Kaufmann (2003), we will build a multi-linear model to attempt to describe the urban land use change per year (the ‘y’ variable) as a function of a number of key socioeconomic factors (e.g. capital investment, land productivity, population, wage rates, etc) (the ‘\(x\)’ variables).
Following the example in the paper, we will use the following in \(x\):
- \(x_1\): Investment in capital construction / population
- \(x_2\): value of gross agricultural output / agriculture population
- \(x_3\): log(wages in non-state, non-collective units)
- \(x_4\): log(average total wage)
- \(x_5\): (value of gross agricultural output/Agricultural land) / (value of gross industrial output / Urban land)
This will give a model with 6 parameters that we need to estimate (i.e. 6 unknowns) that we could call \(p_0, p_1, p_2, p_3, p_4, p_5\). We could then write the model more specifically as:
Equation 1:
Note that the final term (\(x_5\)) requires that we have data for Agricultural and Urban land, which we will need to derive from the remote sensing data for each year of observation.
The rest of the data will come from official statistics.
1.4. Summary
The project involves the following tasks:
1.4.1. Data processing
- Download Landsat annual datasets for 1986 to present (or some suitable subset).
- For one year (your choice), perform a supervised classification and an unsupervised classification using
enviand assess the accuracy of the classifications; - Perform unsupervised classifications (clustering) of the time series of Landsat data, using an
enviprogram that you will be provided with;- apply suitable class labels, and modify the number of classes as appropriate;
- Calculate the area of urban land use for Shenzhen for each year
- Estimate the area of agricultural land use for Shenzhen for each year (if possible, not critical)
- Try to assign a value of uncertainty to the derived data (from earlier accuracy assessment)
1.4.2. Modelling
Following the general approach of Seto & Kaufmann (2003), we will build a multi-linear model to attempt to describe the urban land use change per year (the ‘y’ variable) as a function of a number of key socioeconomic factors (e.g. capital investment, land productivity, population, wage rates, etc) (the ‘\(x\)’ variables).
Equation 1:
The model relates socio-economic variables (constant, plus x1, x2, x3, x4, x5), weighted by model parameters (p0, p1, p2, p3, p4, p5) to predict the rate if change of urban area per year (du_dy).
We have taken a set of observations of du_dy, derived from Landsat land cover classifications for the years 1986 to present (or a subset). Along with estimates of the x variables from the Guangdong yearbook, we have then seen how to produce an esrimate of the model parameters (the p terms).
Using the data derived above, calibrate a model that describes urban land use change as a function of a set of socioeconomic factors, following the approach of Seto et al. (2002, 2003). You are provided with R code and appropriate datasets to achieve this.
Analyse the statistics of the model and experiment to try to find an improved model with fewer parameters.
You are free to perform additional experiment, with the expectation of higher marks, provided (i) you have done the basic requirements well enough, and (ii) you show clarity of thoiught and understanding of what you are doing in your experiments.