![]()
5. ENVI Classification
5.1. Data processing summary of requirements
[60% of marks in total Classification]
5.1.1. Data Exploration and Classification Theory
[30% of marks]
Select data for a single year and download from Google Earth Engine App supplied
For the data selected for the single year:
- Choose one supervised and one unsupervised classification approach (we recommend Maximum Likelihood and ISOData
- Theory: describe how the approaches work (noting similarities and differences) and relate this to the information content of your data. Cite literature as appropriate. [10%]
- Perform a supervised classification and an unsupervised classification using
envi, relating the training information (e.g. class seperability) to the material presented above; - Present the results of the classification and assess the accuracy of these classifications; [15%]
- Discuss the issues raised and how this might translate to unsupervised classification of the whole time series. [5%]
5.1.2. Time Series Classification
[30% of marks in Part 2b]
- Download Landsat annual datasets for 1986 to present (or some suitable subset of at least 18 years): you can copy the data from the GEOG0027 archive
- Perform an unsupervised classifications (clustering) of the time series of Landsat data, using an
enviprogram that you will be provided with (classy.pro); - apply suitable class labels, and modify the number of classes as appropriate;
- Calculate the area of urban land use for Shenzhen for each year
- Estimate the area of agricultural land use for Shenzhen for each year (if possible, not critical)
- Try to assign a value of uncertainty to the derived data (from earlier accuracy assessment)
- Write up this section of work, describing:
- the tasks undertaken (materials and method) [5%]
- the experiments conducted (e.g. with varying class number/waveband) [10%]
- the results and uncertainty [10%]
- discussion of the results (in context of text above) [5%]
Prepared by:
Dr Qingling Wu, Prof Philip Lewis, Dr Mathias Disney
Contact: Professor Lewis
5.2. Extraction of land use extent
Your task in this section is to calculate the area of land cover & land use (LULC) extent (in \(m^2\)) for each year of a series of Landsat imagery. If possible, you should provide an associated characterization of uncertainty in each of these areas.
Along the way, you will need to do a manual classification (one supervised, one unsupervised) in envi. As a first step, we should try to quantify at least three types (urban, agricultural, and other) of land uses for each given year. A number of classification methods have been taught in this module, and Maximum Likelihood is a good starting point for multispectral TM imagery. There are also other image processing methods could help to identify land use classes (e.g. vegetation
indices, filters, segmentation, etc.). Then, we can identify where changes have happened and how much land area has been transformed into urban built.
You then need to run an automated processing script classy.pro in envi to apply unsupervised classification to the whole time series of data.
For the modelling section of this report, it is critical that you extract a reasonable estimate of urban land cover for each year (it is not vital to do every year, but once you get started, this should not be too much bother). Agricultural land use should only be attempted if it proves feasible. If you do not believe it so, make a case in your report for not generating this cover class, and make sure you provide evidence to back this up. An acceptable excuse might,, for instance be that agriculture cannot be easily distinguished from other vegetation types in an annual dataset, but you would need to provide evidence of this. Also, some of the agricultural land use in the region is rice paddies, which might have rather similar signatures to other shallow water areas (if you want to claim that, provide evidence, e.g. spectra).
5.3. Obtaining Landsat data
See the section Google Download for information on how to obtain and explore data. You should go through this section carefully, building your understanding of the datasets you are using. Take note of the ‘hints’ as to what might be interesting to explore (and put in your report). We suggest you access data using this approach.
An alternative source of data is direct from the USGS, which you can explore in the Download page, including how to search only for the area we are interested in. It is certainly not critical that you explore this for this practical, but you should find it of general use, and might, for example, use it to discuss issues (e.g. cloud) with using individual Landsat scenes, rather than the composites we make available via Google Earth Engine.
In any case, remember to write up each of the steps you go through in producing the input dataset for classification, and provide appropriate evidence. Note the guidelines and weightings given at the top of this section.
5.4. Classifying the data: manual method
You should now have a set of (annual) image subsets (and associated masks, if required) of the area of interest.
You next need to generalise the datasets into classification maps.
Although we will process the bulk of the data automatically, you will need to show that you can do a ‘manual’ classification.
For this reason, we require you to select one year (your choice) and perform a supervised classification and an unsupervised classification using ``envi``.
You should provide an assessment of the accuracy of the classifications (truth tables), concentrating on the ability to distinguish urban, agriculture and other (you may go into more detail with other).
You can use these accuracy assessments as an estimate of the uncertainty in the classifications when it comes to the modelling section (e.g. if you get an 80% accuracy on the urban class, you could suggest that there is roughly a 20% error on this class).
You can either work on the whole extent of the downloaded dataset, or just use a mask for the Shenzhen region. Make sure you are clear about which of these you have chosen to do.
5.5. Automated processing
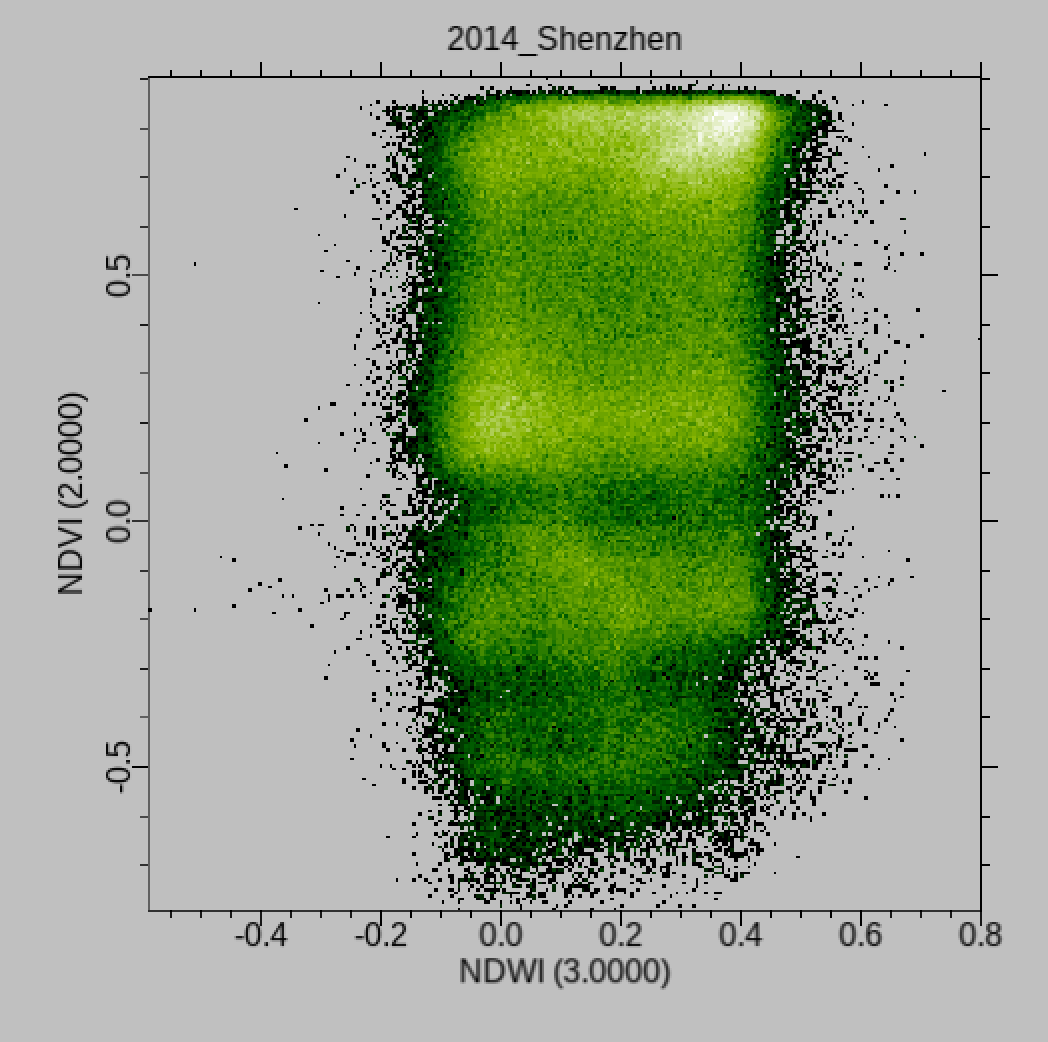
We will use an ISOData clustering approach to process the full time series of data. You should make sure you are familiar with this approach and any issues in its use. As it is an unsupervised method, you will need to specify the number of classes you want. This choice should be based (at least initially) on your assessment of the datasets (e.g. the clusters you see in the NDVI / NDWI scatterplots):
Note that the automated processing will use only the NDVI and NDWI channels of information (‘bands’ if you like), by default for ease of processing and interpretation. You do have control over which bands are used, so you should experiment with that (e.g. cluster using all bands, or just vegetation indices).
Note that your results will be over-written each time you run the ``envi`` scripts so you will want to make copies of results for a particular setting (e.g. bands. or number of clusters)
To use the automated processing, you should first download the relevant files and place them in your data directory.
5.6. Loading the automation software
Start envi.
You should have a window (terminal/shell) that shows the ENVI> prompt. This is where we will type ’envi(actually,IDL`) commands.
First, make sure you are in your data directory:
ENVI> CD, '~/DATA/GEOG0027'
You can type Unix commands at this prompt if you put a $ before the command, so if we want to check the files that are there, type:
ENVI> $ls
You should see the following:
1986        1994        2002        2010        2018
1987        1995        2003        2011        2019
1988        1996        2004        2012        classy.pro
1989        1997        2005        2013        classy_lut1.dat
1990        1998        2006        2014
1991        1999        2007        2015
1992        2000        2008        2016
1993        2001        2009        2017
The automation code is in the file classy.pro, so we will get envi to load this:
ENVI> .compile classy
This should respond with:
% Compiled module: REAL_CLASSY.
% Compiled module: CLASSY.
% Compiled module: FIX_CLASS.
% Compiled module: MAKE_GIF.
% Compiled module: MAKE_MOVIE.
which is a list of the modules available to you.
We can explore first CLASSY.
; NAME:
;   classy
;
; PURPOSE:
;   Performs classification (clustering) on image
;   using ISOdata
;
; INPUTS:
;   input_file - name of envi image to read
;   nclasses - how many classesa (default 5)
;   bands    - band numbers to use (default [5,6])
;              use 0 for the 1st band. Max of 6
;
; OUTPUTS:
;    input_file + '_class'   - classification ENVI file
;
; AUTHOR:
;   P.Lewis, UCL 26 Jan 2019 (p.lewis@ucl.ac.uk)
;
Let’s first look at a Landsat file '2000/2000_Shenzhen. We can load this into envi and visualise the Vegetation indices:
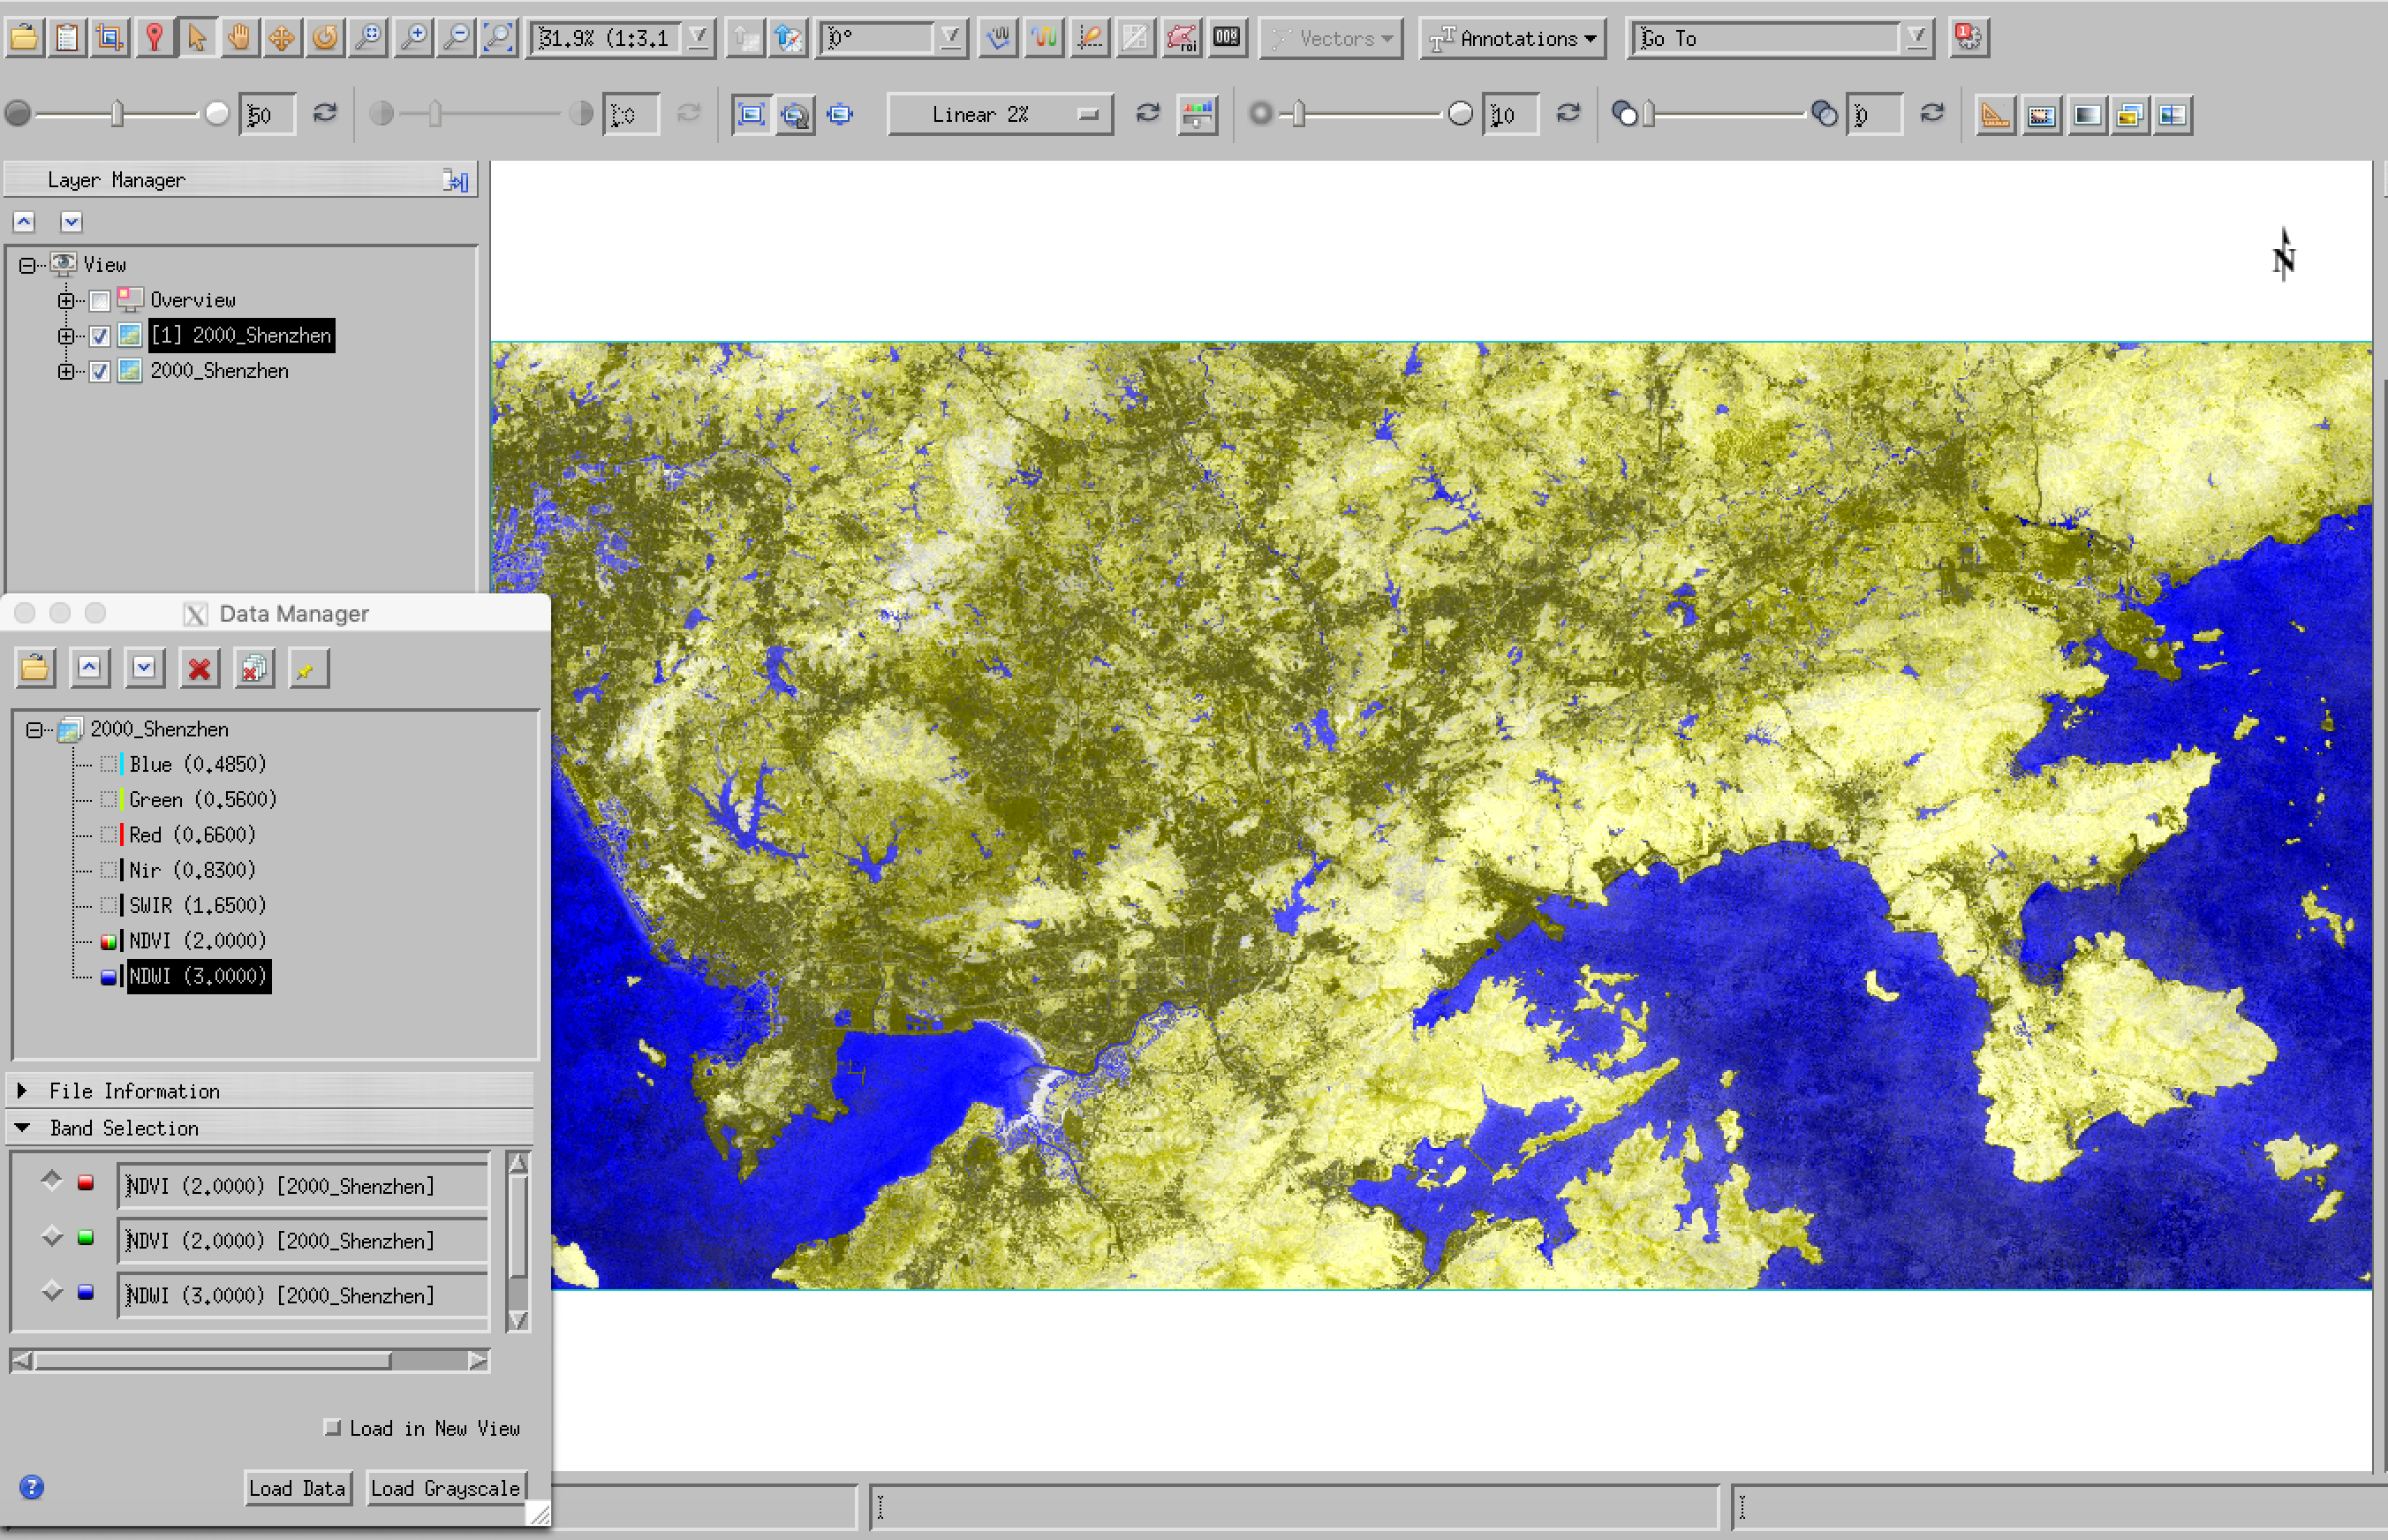
We can see from this (and the scatter plot) that these two bands alone provide a good deal of discrimination of the main cover types. Let’s have a go at generating 3 clusters:
For this module, you specify an input_file to process, and optionally the number of classes and the image bands to use (specify as e.g. [0,1,2,3,4,5,6] for all bands), so, for example:
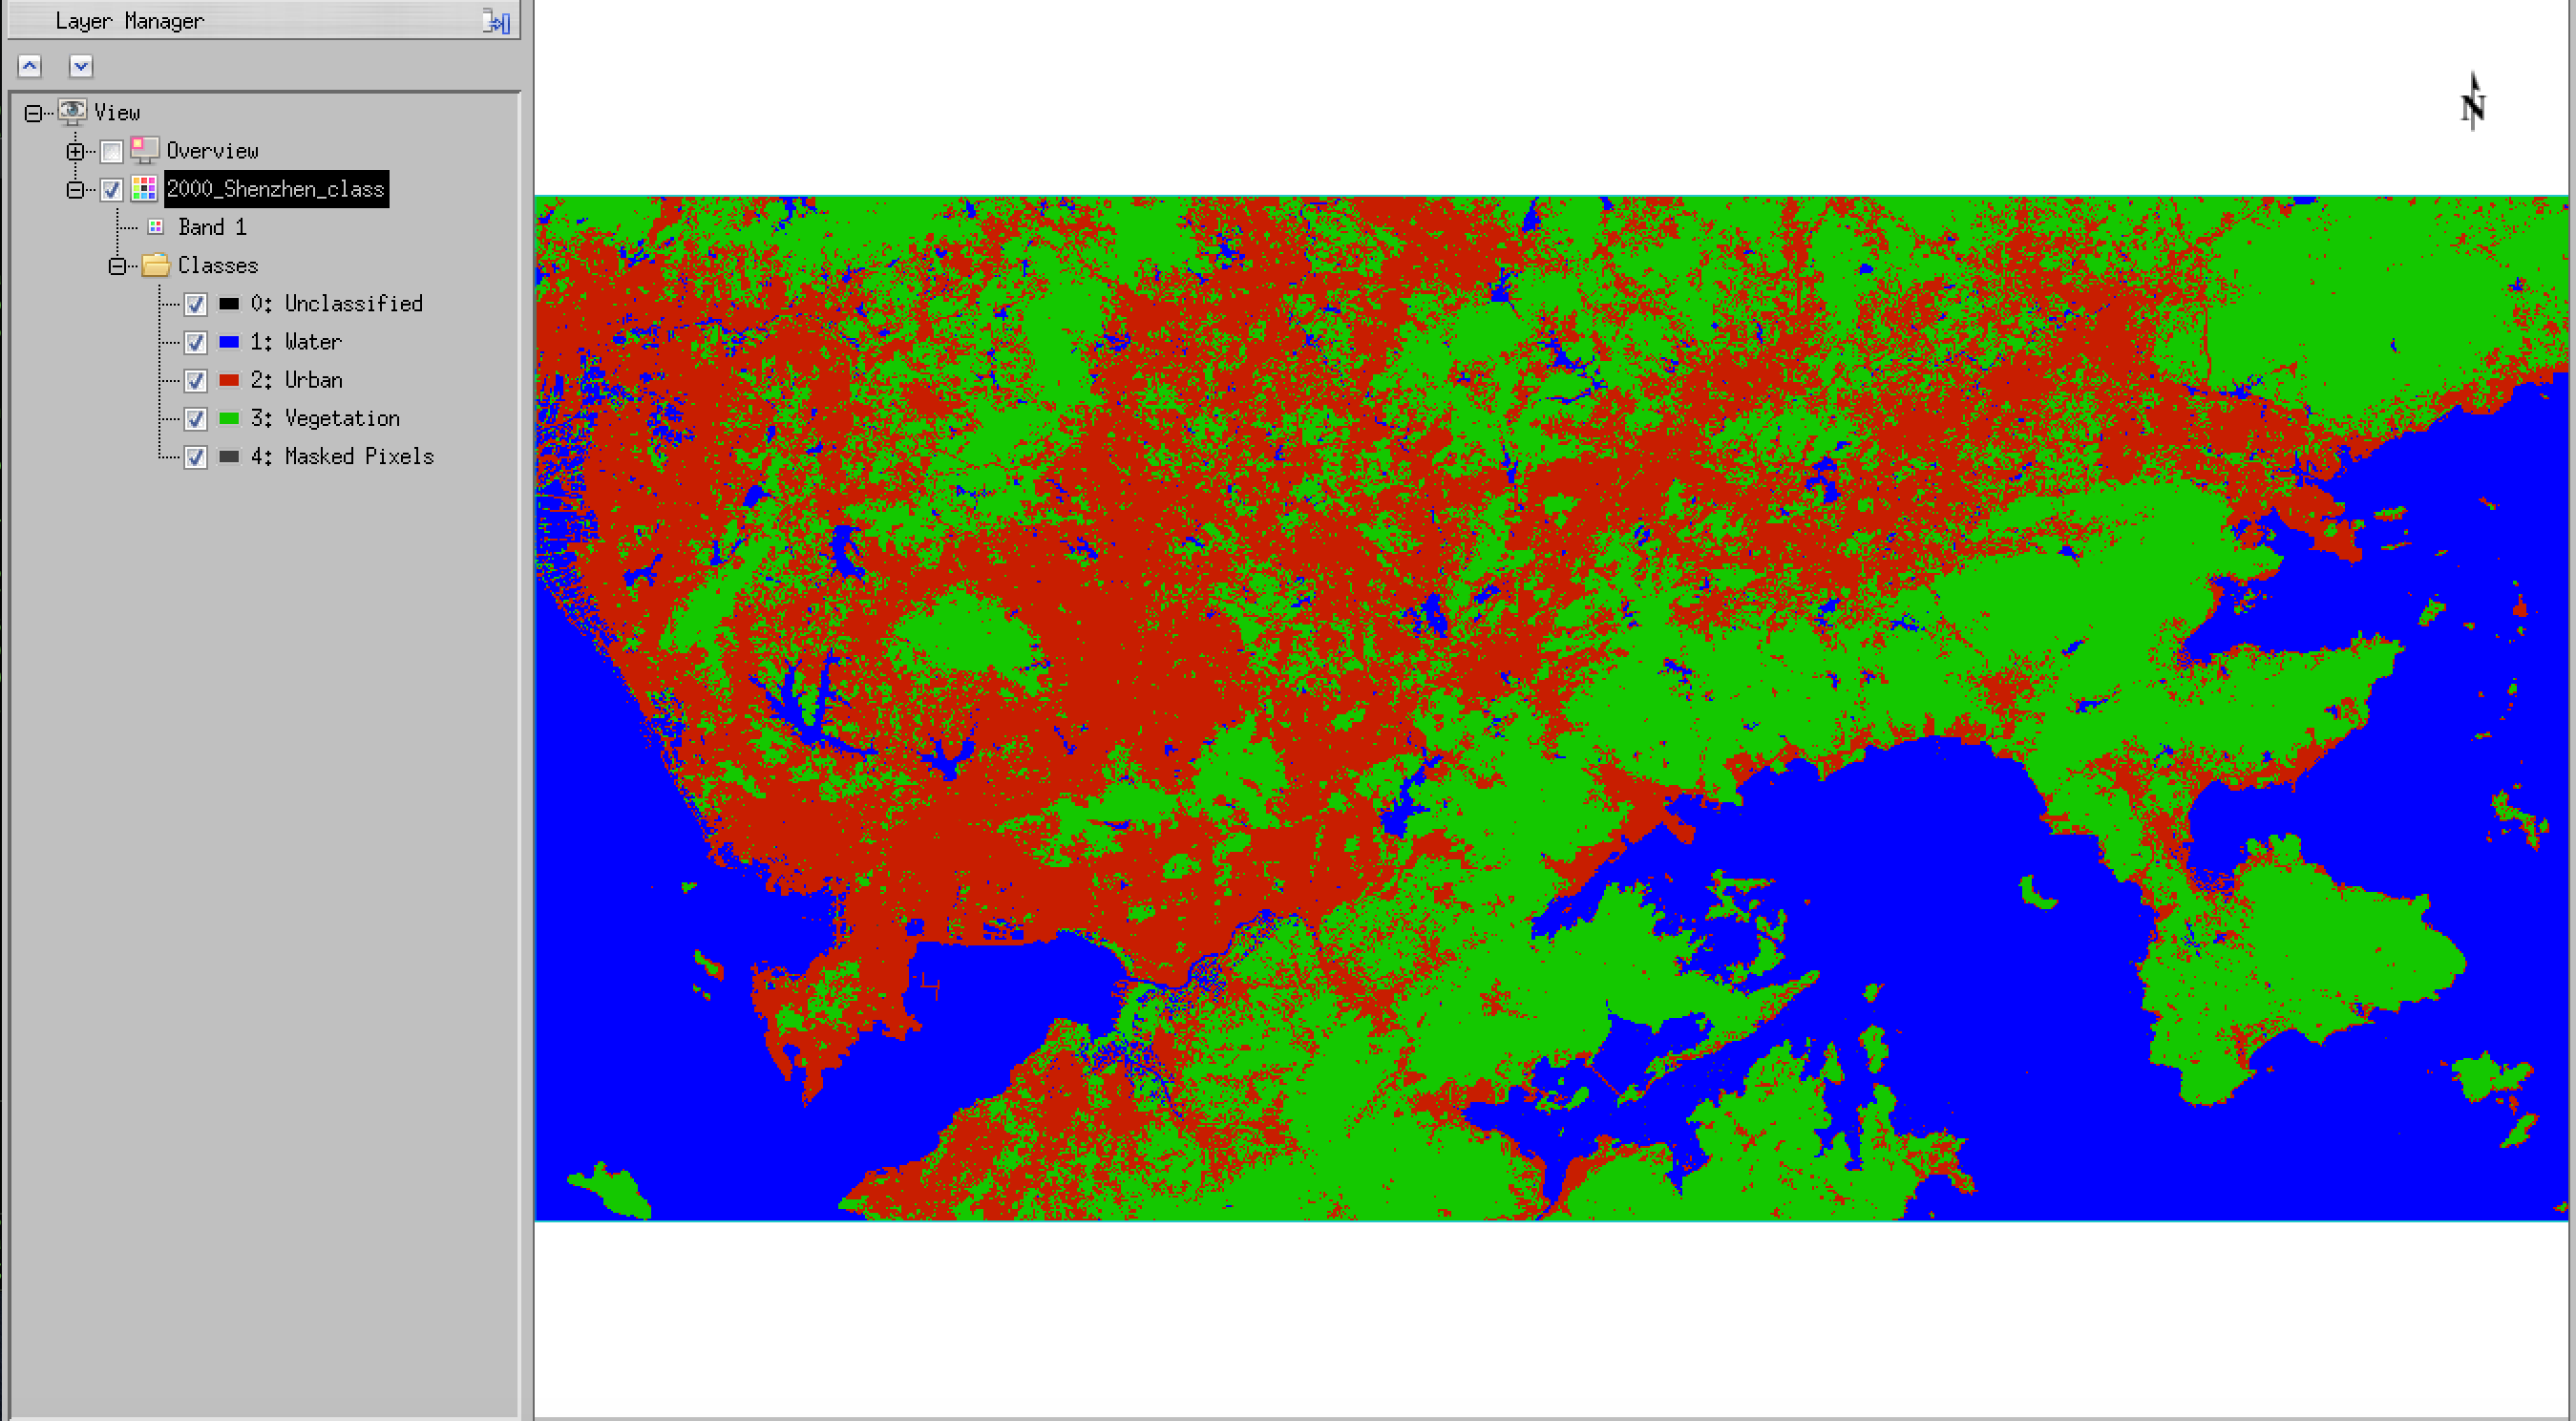
ENVI> CLASSY, '2000/2000_Shenzhen', 3, [5,6]
The result of running this should be an envi file 2000/2000_Shenzhen_class.
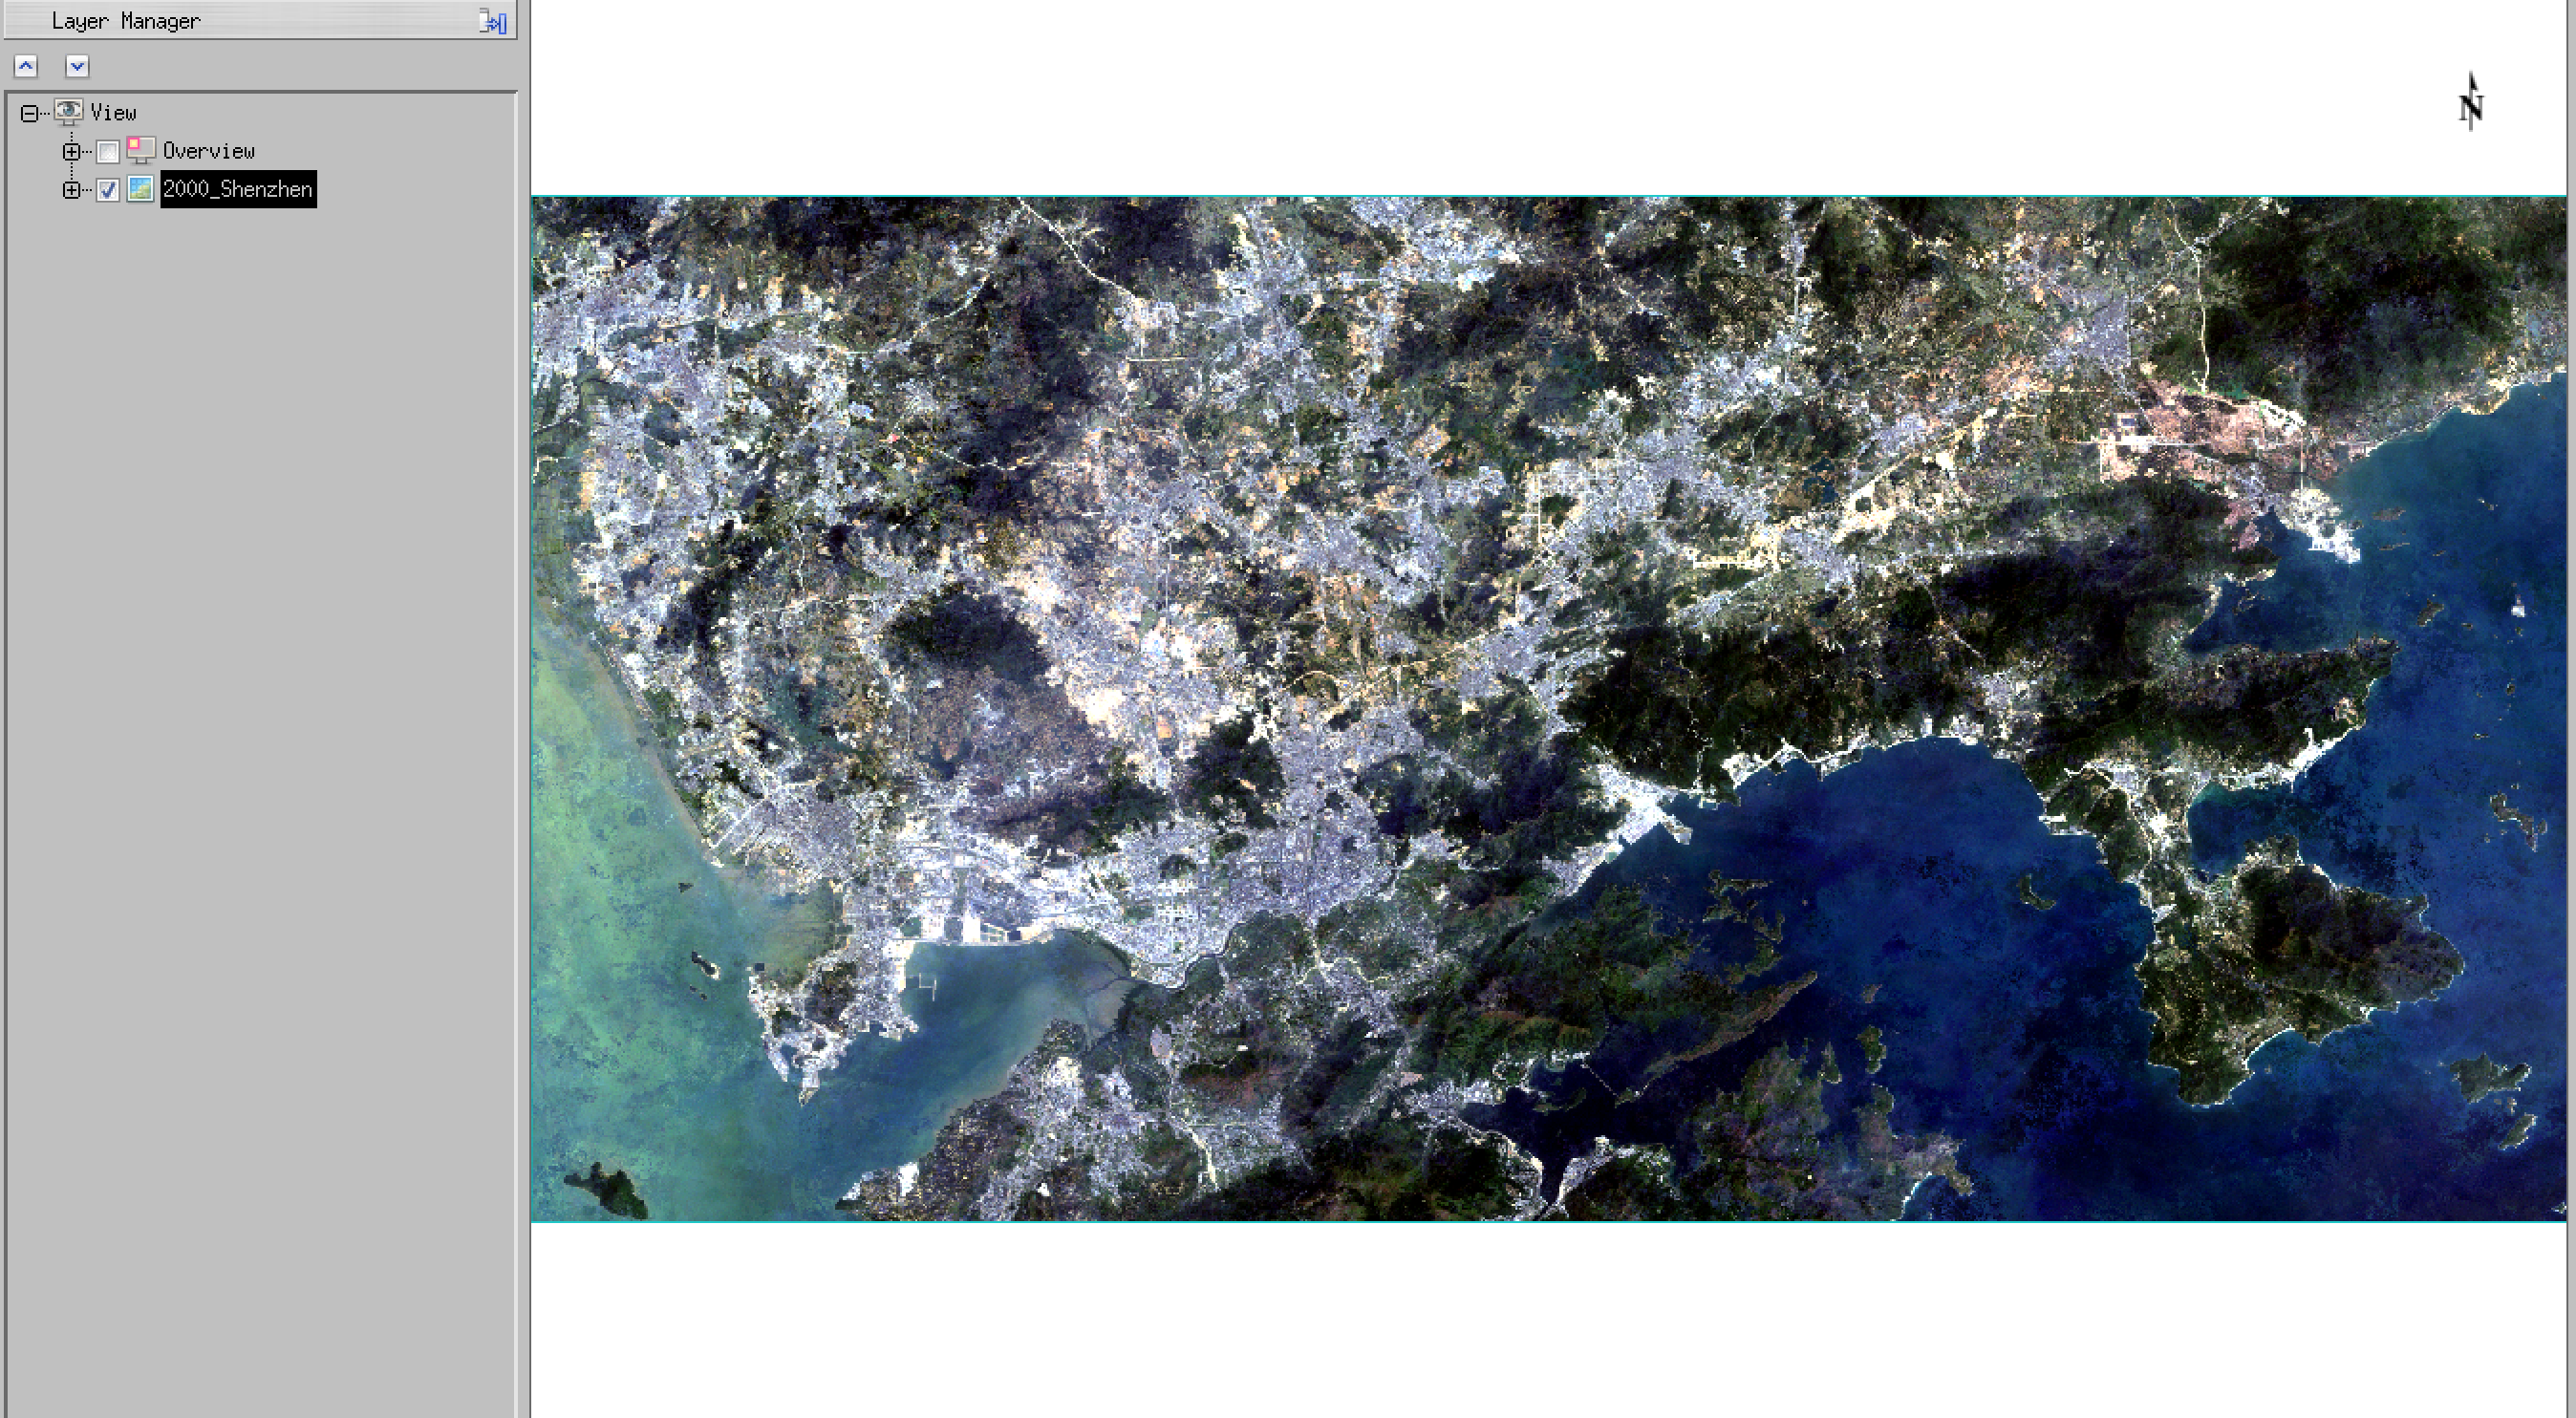
You can load that into envi using the usual menu system:

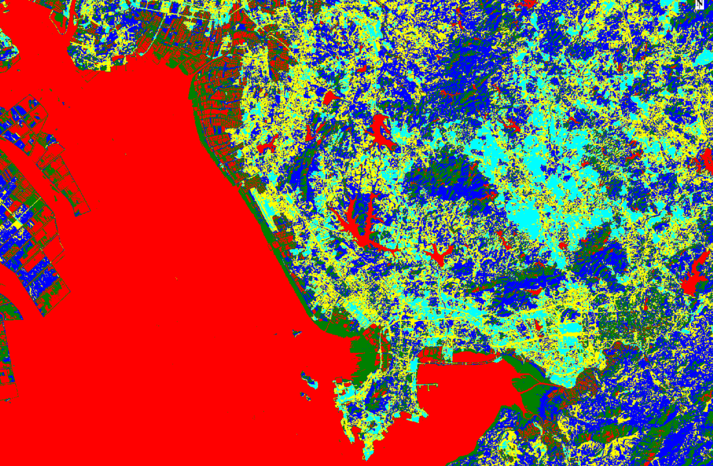
and we can see that this has been quite effective at pulling out 3 main cover types, namely water (Class 1 in red), bare soil and urban (Class 2 in green) and vegetation (Class 3 in blue). You should refer back to the original RGB image to confirm these interpretations:
You might decide that 3 clusters is sufficient: we have a vegetation class, even if its not explicitly agriculture, and we have an urban class (even though it probably includes areas of bare land as well).
If we decide that this is enough, we can process the whole time series on this basis.
First, we need to generate a text file to translate the class labels and colour to something more convenient.
We use a look up table (LUT) text file classy_lut3.dat:
Unclassified, 0,   0,   0
Water, 0,   0,   255
Urban, 200,   30, 0
Vegetation, 20, 200, 0
Masked Pixels, 64,  64,  64
This has, as well as the 3 clusters we wanted, a specification for Unclassified (class label 0) and Masked Pixels (class label 4) in case there are either of these.
Other than that, each line gives comma separated values of:
NAME, R, G, B
where NAME is the class name we want to use, and RGB are numbers between 0 and 255 that specify the colour and intensity to use. For example 0, 255, 0 would be bright green, 255, 255, 0 would be bright yellow.
Lets use this now to re-code the dataset:
ENVI> FIX_CLASS,'2000/2000_Shenzhen','classy_lut3.dat'
where we specify the file to operate on, and the LUT file.
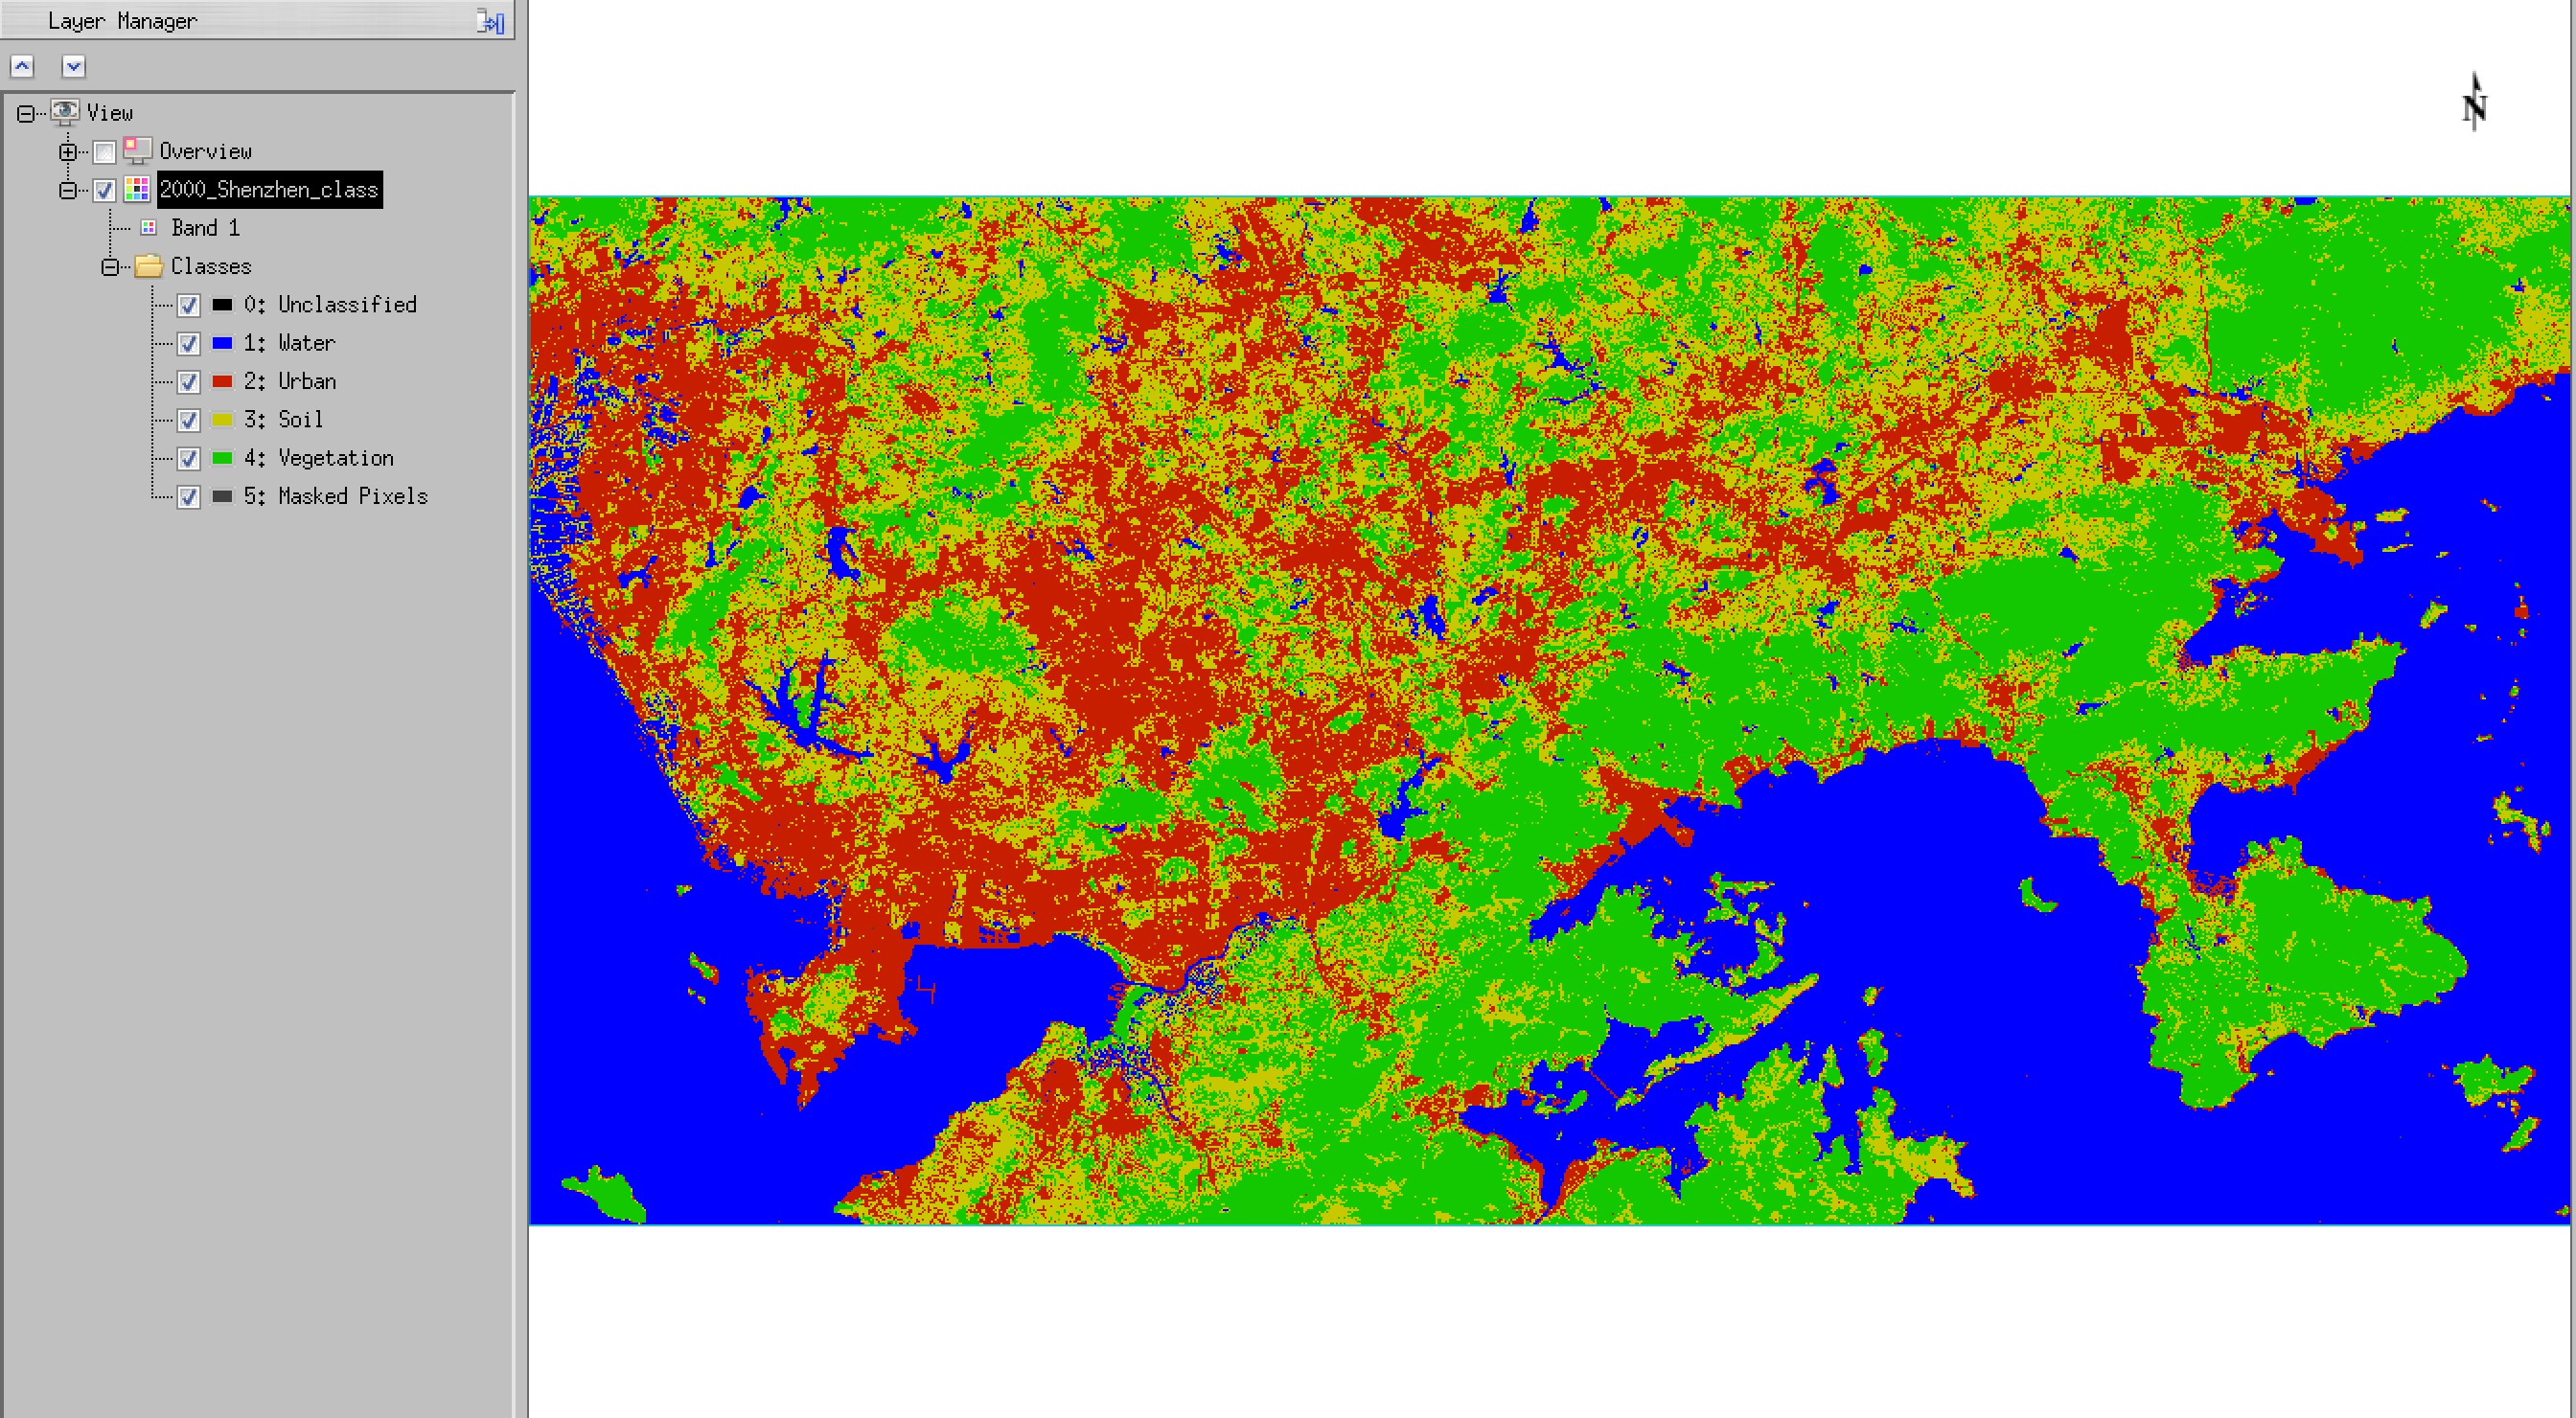
This results in:
which is an appropriate interpretation of the clusters.
Note that if you change the wavebands used or the number of clusters, your image result will be over-written. To avoid this, open the dataset in envi, and save with a different filename (eg one containing the bands used and number of classes)
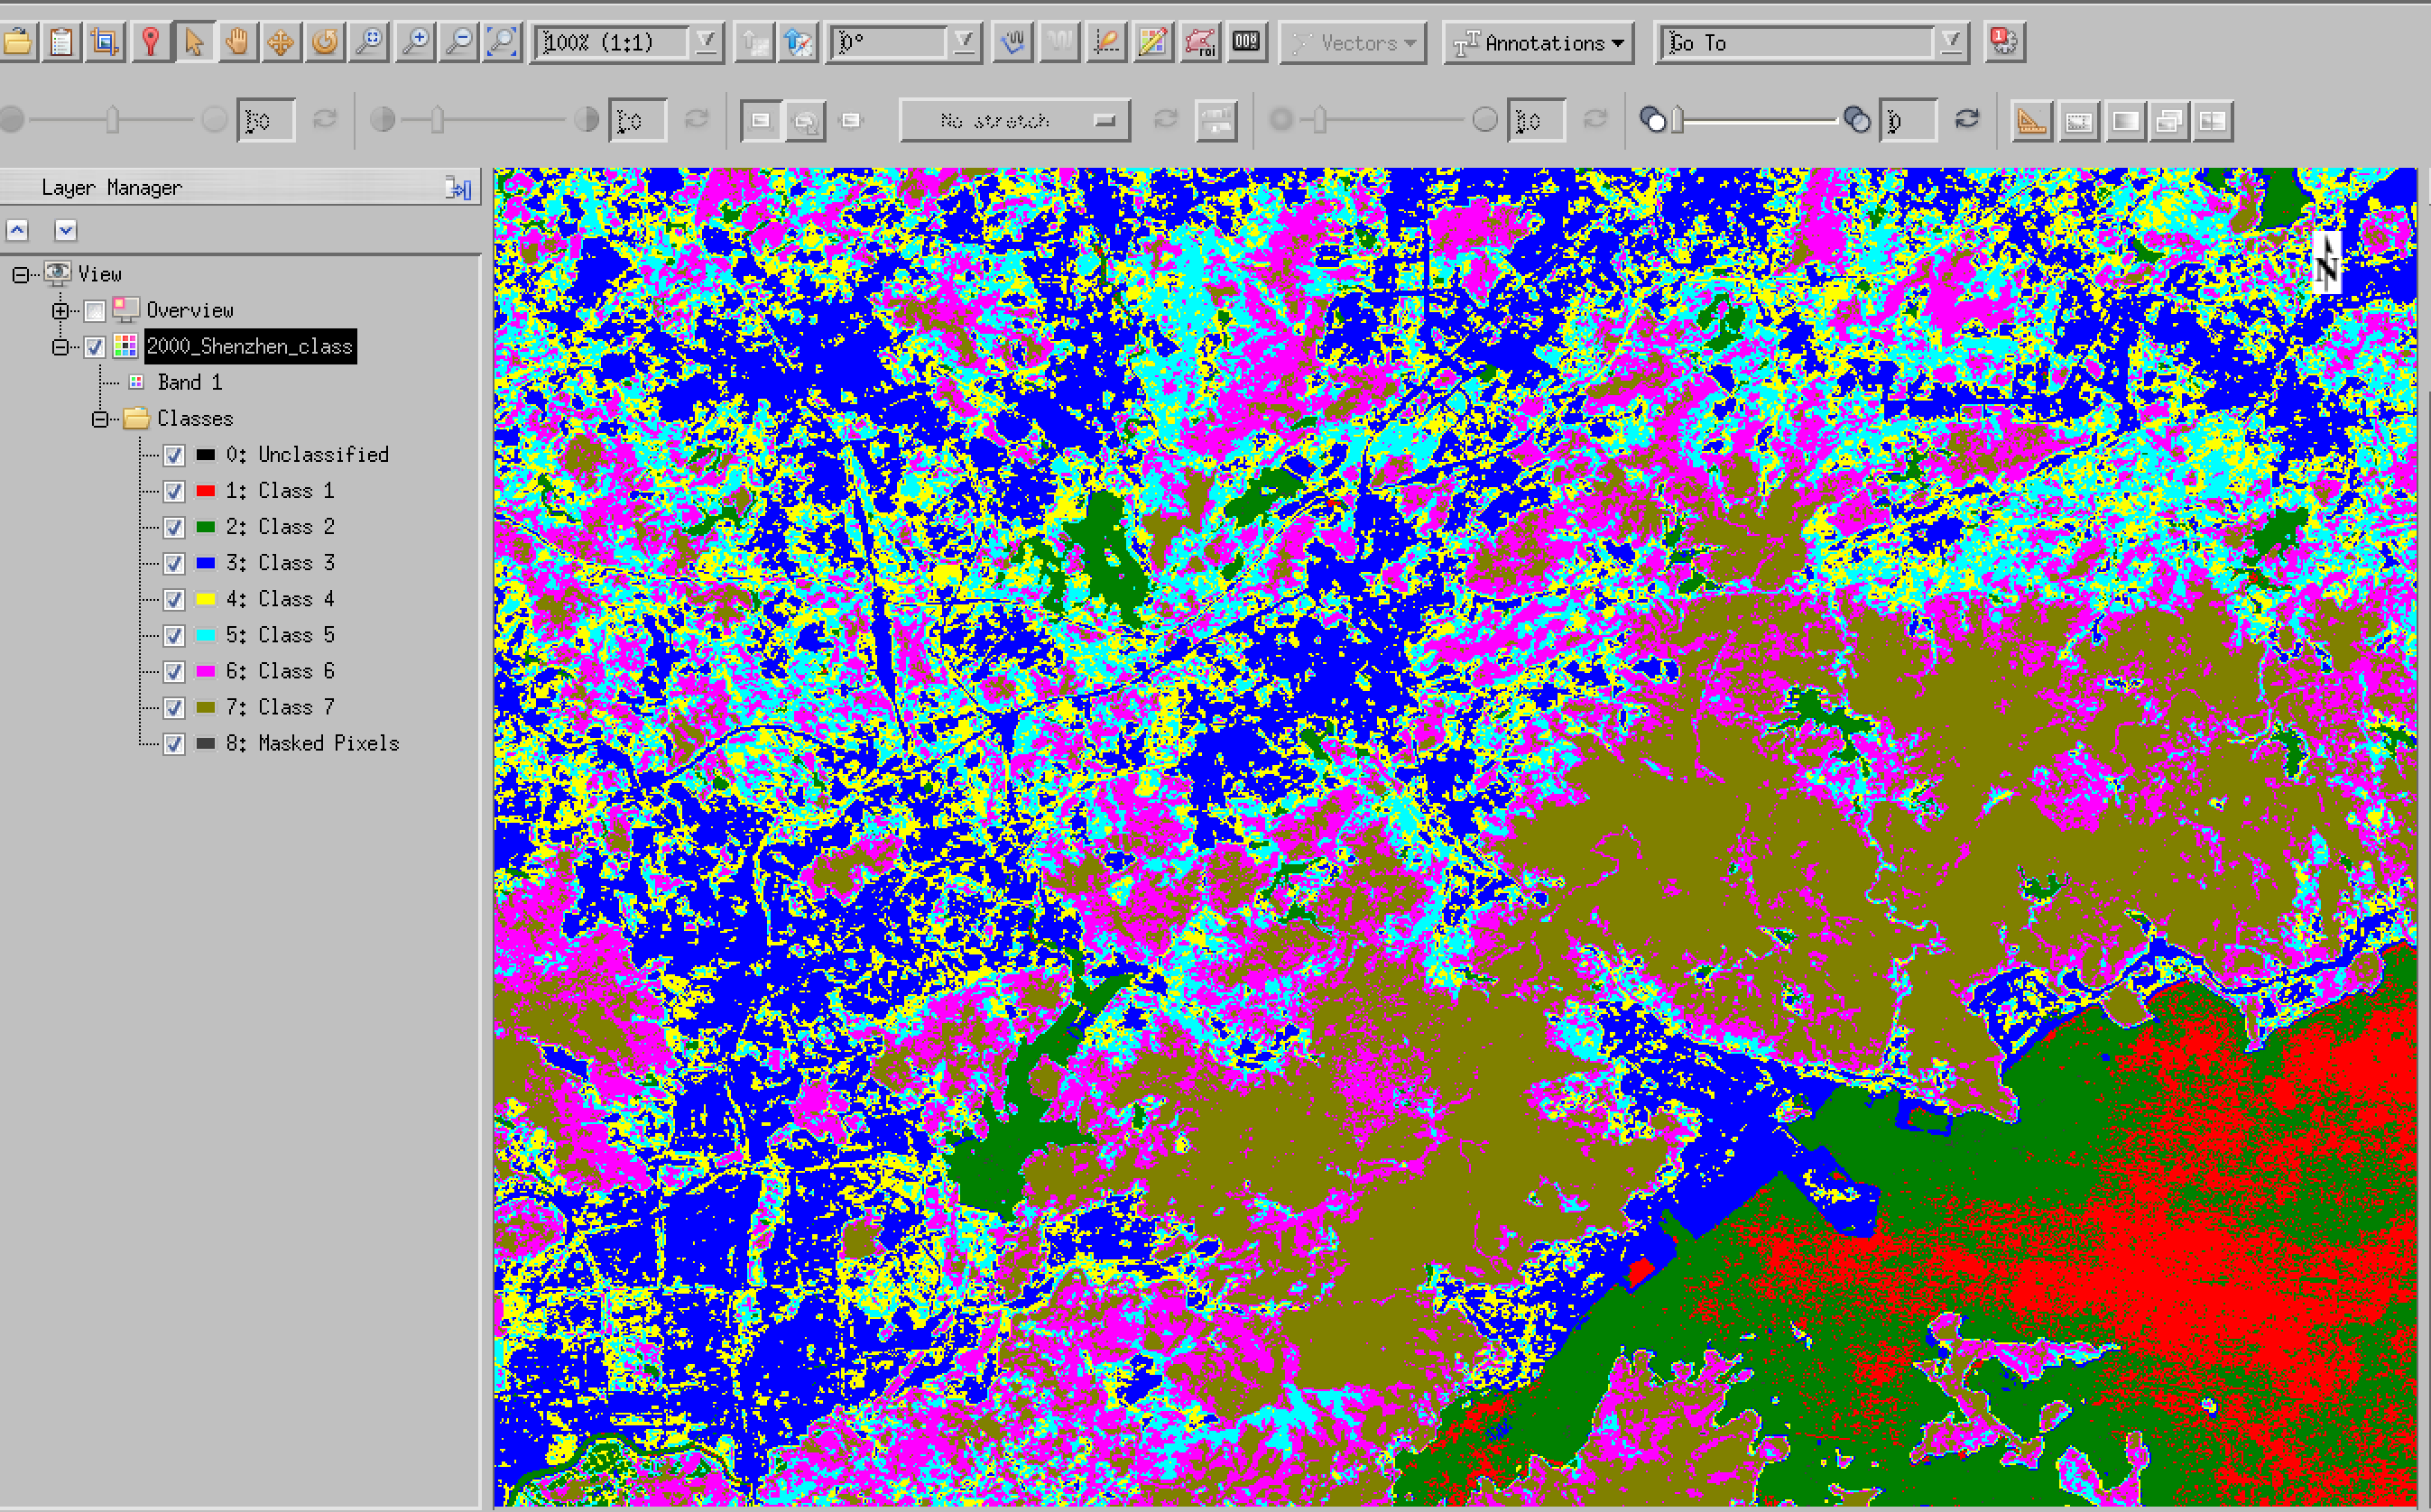
Of course, we might decide to use more clusters (7 here) to get more subtle interpretations, but we will find the classes rather harder to interpret. Possibly the best answer lies somewhere in between. You will need to explore that and come to some (justified) conclusion.
Once we decide that we have probably got a good set up (and an appropriate LUT file), we can set the whole time series processing:
ENVI> REAL_CLASSY,'.','classy_lut3.dat',[5,6]
This uses the module REAL_CLASSY and then specifies the directory to work in (. is the current directory, which is appropriate here), and then the LUT file to use, and the bands as above (use [0,1,2,3,4,5,6] for all bands). The number of classes to use is inferred from the number of entries in the LUT file.
This script will take a few minutes (or a little longer if more classes are specified), but will look over all of the directories containing the annual Landsat datasets (specified by year).
Once this is done, it applies the specified LUT to the classifications, and then generates a series of gif files that you can use in your report (each with the year labelled on the classification image).
Finally, an animated gif ‘movie’ is created:
You should use this animation (and the associated gif files) to come to some conclusions about your selection of the number of classes. In this case, we can see that the Water class is useful and stable (although it includes rice paddies in the top left of the image). There seems to be some jumping around between the vegetation and urban classes however: we would generally expect an increase in the urban area and a decrease in the vegetation over time. Because we have only used 3 classes
here, the clusters that form sometime include other features, such as bare land, and sometimes don’t. This means that our class efinitions aren’t very stable.
It may be that some subset of the years that we have processed appears stable, and that may be enough to perform the modelling: in essence, we need at least 6 years of data over the time period for which we have the socioeconomic data to be able to provide an estimate of the 6 model parameters. Ideally, we should have at least twice that number.
If not, you may wish to explore other numbers of clusters and the wavebands used. Make sure you note down your experimentation (with plenty of appropriate figures) in your report. Make sure you save each classified image set you derive if you change the bands or n umber of clusters.
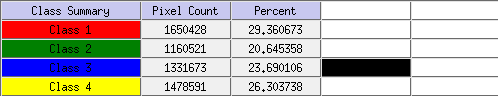
5.7. Pixel counting
Finally, you will need to provide a count of the total area of each class, with each pixel being 30 m x 30 m. To do this, you need to count how many pixels are in each class.
You can do this in envi following the menu items (right hand panel) Classification -> Post Classification -> Class Statistics.
This will produce the data you need to track land cover for each date. Make a note of the pixel counts for each year.
Alternatively, the module getstats (in classy.pro):
getStats,fixfile,results
will write the pixel counts, with appropriate headers, to a CSV format file results-YEAR.csv, where YEAR is the year you perform the experiment (so, 2019 in 2019).
An example output is:
Year,Unclassified,Water,Urban,Soil,Vegetation,Masked Pixels,
1986 ,           0 ,     1688763 ,      728147 ,     1599277 ,     1605031 ,           2 ,
1987 ,           0 ,     1686052 ,      966379 ,     1422736 ,     1546047 ,           6 ,
1988 ,           0 ,     1688295 ,      753086 ,     1554130 ,     1625708 ,           1 ,
1989 ,           0 ,     1698172 ,      664438 ,     1599387 ,     1659223 ,           0 ,
1990 ,           0 ,     1676593 ,      622059 ,     1592331 ,     1730237 ,           0 ,
1991 ,           0 ,     1692487 ,      678761 ,     1492200 ,     1757772 ,           0 ,
1992 ,           0 ,     1714083 ,      836708 ,     1531097 ,     1539332 ,           0 ,
1993 ,           0 ,     1703089 ,     1033756 ,     1377726 ,     1506649 ,           0 ,
1994 ,           0 ,     1690201 ,     1077816 ,     1355426 ,     1497777 ,           0 ,
1995 ,           0 ,     1663186 ,     1114267 ,     1440417 ,     1403216 ,         134 ,
1996 ,           0 ,     1657710 ,     1127971 ,     1437053 ,     1398486 ,           0 ,
1997 ,           0 ,     1660290 ,     1078099 ,     1450867 ,     1431964 ,           0 ,
1998 ,           0 ,     1635837 ,     1087832 ,     1375363 ,     1522183 ,           5 ,
1999 ,           0 ,     1637807 ,     1221455 ,     1436375 ,     1325578 ,           5 ,
2000 ,           0 ,     1650428 ,     1160521 ,     1331673 ,     1478591 ,           7 ,
2001 ,           0 ,     1625689 ,     1172997 ,     1387558 ,     1434976 ,           0 ,
2002 ,           0 ,     1611018 ,     1234615 ,     1413538 ,     1362048 ,           1 ,
2003 ,           0 ,     1597141 ,     1295468 ,     1290879 ,     1437730 ,           2 ,
2004 ,           0 ,     1580141 ,     1386381 ,     1287383 ,     1367297 ,          18 ,
5.8. Summary
[60% of marks in total Classification]
5.8.1. Part 2a: Data Exploration and Classification Theory
[30% of marks in Part 2a]
For the data selected for the single year:
- Choose one supervised and one unsupervised classification approach (we recommend Maximum Likelihood and ISOData
- Theory: describe how the approaches work (noting similarities and differences) and relate this to the information content of your data. Cite literature as appropriate. [10%]
- Perform a supervised classification and an unsupervised classification using
envi, relating the training information (e.g. class seperability) to the material presented above; - Present the results of the classification and assess the accuracy of these classifications; [15%]
- Discuss the issues raised and how this might translate to unsupervised classification of the whole time series. [5%]
5.8.2. Part 2a: Time Series Classification
[30% of marks in Part 2b]
- Download Landsat annual datasets for 1986 to present (or some suitable subset of at least 18 years): you can copy the data from the GEOG0027 archive
- Perform an unsupervised classifications (clustering) of the time series of Landsat data, using an
enviprogram that you will be provided with (classy.pro); - apply suitable class labels, and modify the number of classes as appropriate;
- Calculate the area of urban land use for Shenzhen for each year
- Estimate the area of agricultural land use for Shenzhen for each year (if possible, not critical)
- Try to assign a value of uncertainty to the derived data (from earlier accuracy assessment)
- Write up this section of work, describing:
- the tasks undertaken (materials and method) [5%]
- the experiments conducted (e.g. with varying class number/waveband) [10%]
- the results and uncertainty [10%]
- discussion of the results (in context of text above) [5%]